

Do I Stay or Do I Go?

")
Hi all, I’ve been a little lazy this month. The last two months have had roughly a 15% bounce but have not reached the S&P high set on 20 May last year of 2,134. At the moment we are just above the 2,090 mark. The 2,080 to the high of 2134 looks like a death zone or Bull Graveyard. Since the last day of 2014 the bull has taken a run at it nearly 13 times based on daily charts and failed.
Now look at the chart below and you see how it looks like a ‘Bearish Top’.
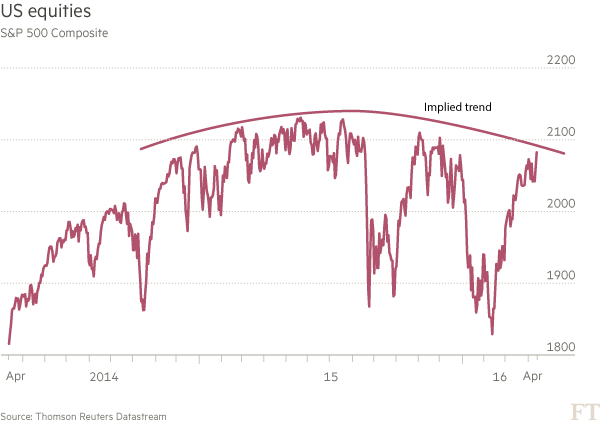
The S&P has been on a run since February 11 this year and yes it is now positive for the year to date. So the correction is over and its back to business as usual, or as Buzz LightYear would say, ‘To infinity and beyond’.
Hold on though, take a look at what happened in 2008 and you will see that on the way down you always get rallies. Using the interactive charting on the markets section of the FT you can look at data on the DOW from 1st of April 1914 to today. I looked at 1929-1932, the Asian Crisis of 1997, Dotcom in 2001, Oil Crisis in 1973-1974 and our recent Subprime Crisis in 2008. I think its fair to say that every single Bear market has rallies and this is no different.
Think of this from 1901 to today we have had 21 official Bear markets, during these 14 of them had rallies that were more than 15%. Since 1945 Bear markets have had rallies of 11% that more than recovered 60% of the decline.
This coupled with the fact that stocks are at crazy valuations. And you can pick your measurement criteria, price to earnings, cash flow, book value. It doesn’t make any difference. 10-20 year bonds in the most stable countries are guaranteeing you a loss!
March comes in like a Lamb but the Bear is waiting, (We haven’t gone away you know as Gerry Adams liked to say). Bear markets don’t die of old age but of excesses. Can’t remember where I read this but someone is looking for admittance to heaven and God tells him? ‘The light that burns brightly, burns twice as fast and you my friend have burned so very brightly’. That’s how I think of where we are now. If the MAC-D(momentum measure) on the monthly goes positive and/or we can make new highs above 2140 ‘ish S&P500, then this will be invalidated and the Bull market is back in business. At the moment its like the last days of the Roman Empire, no-one knows it, but the Barbarians are at the gate!
Shipping

The Baltic Dry Goods Index is a mess. The lowest its ever been. Companies that ordered ships during the boom to service China are now finding they are entering service at the worst possible time. In some cases these new ships are worth little more than scrap. This is causing the shipping market to begin to collapse as they are surviving on cash reserves. Check out the London listed Goldenport(GPRT:LSE) £51.33 in 2007, after the 2008 correction is was £8.77. Today its just over 1 penny!!
Hedge Funds
I find it interesting to see how Hedge funds are performing. These are the golden boys of fund management. With their fee structure of 2 and 20 or in English a 2% yearly management fee and a 20% take on any profits they are usually very profitable. They have the enviable ability to short or profit from a decline in most asset classes as well as gaining if the asset class rises. So whats going on? As we have seen mainly one way traffic on most of the major indices since march 2009, a lot of investors are saying ‘why are we paying such high fees when we can pay only 0.7% on a passive ETF’, that just tracks certain indices in one direction which has been mainly up until August 2015. There is always a delay of about 3 to 6 months with redemptions from funds as most investors only look at them quarterly or every 6 months and then make a decision to stay or leave. Also funds can have penalty clauses if you leave too early or not give enough notice. Anyway as a result, investors have taken roughly $15 billion in assets from hedge funds in the first quarter, the worst withdrawal since 2009. Note this is based on US hedge funds. It does not include the likes of UK blue blooded Odey Capital Management in London. Their not as smart as we really think they are. In his case I think the emperor really has no cloths. Anyway we all know what happened in 2008 so for me this does not look good at all.

George Soros
Now for someone I have a lot of time for. Soros said that China “eerily resembles what happened during the financial crisis in the U.S. in 2007-08, which was similarly fueled by credit growth,” He also said, “Most of the money that banks are supplying is needed to keep bad debts and loss-making enterprises alive.”
Soros is not someone who looks for attention and is not a guff merchant but someone who has got it right consistently for the last half century.
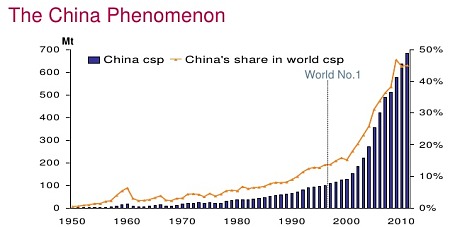
I think China is one big ‘Financial Frankenstein’ that’s ready to pop. Command and control economies(Communist) don’t work long term and this is a $10 Trillion economy that has grown by over 50 times in the last 20 years. Take a good look at the picture below and think about it for a few minutes. China has used more cement in 3 years that the US has since 1916!!

Now look at China’s steel output.
No wonder there are so many jobs being lost worldwide in steel manufacturing, not just Port Talbot in Wales. 10% of its 37,000 population are employed there. Once those jobs are lost you never get them back.
Positives
Energy(XLE) and Materials(XLB) are up over 10% year to date in the US and over 15% worldwide excluding the USA. Usually the US leads but not now.
The Russian stock market is up over 26% year to date with Mobile TeleSystems up over 50%, Rosneft 47%. Who said that economic sanctions were bad for a country? They must be doing something right.
In South America, Brazil is up over 40%, Peru nearly 50%, year to date.
In the Middle East Turkey is up nearly 30%, year to date.
Malaysia, Thailand and Indonesia all up over 15%, year to date.
In Africa of the 8 largest international funds investing directly in African countries have seen a performance of on average 10.3 %, year to date.
On the Capital markets the star performer is the 20 year US Treasury Bond which is up 5.7% year to date.
So at least I ended on a positive note. Hope you all have a good spring, best wishes,
Pearse.

Great insights, pleasure to read! Thanks.
LikeLike
Thanks Pearse,
Leonard
LikeLike
Nice work Pearse
LikeLike
Reblogged this on FXTraderPauls Trading Adventures and commented:
I always enjoy reading the big-picture thoughts of my friend Pearse’s monthly post. I hope you do too!
LikeLike
Great read!!
LikeLike
Nice job, Pearse. good research
LikeLike